
Página — Uerakua Anapu Uantakua Projects And Readings 3° Secundaria (pág. 173)
Solución no disponible aún
Esta página está en proceso de revisión.
Pídela y la resolveremos antes. Sin registro.
📝 Transcripción de la página (texto seleccionable) 2413 caracteres
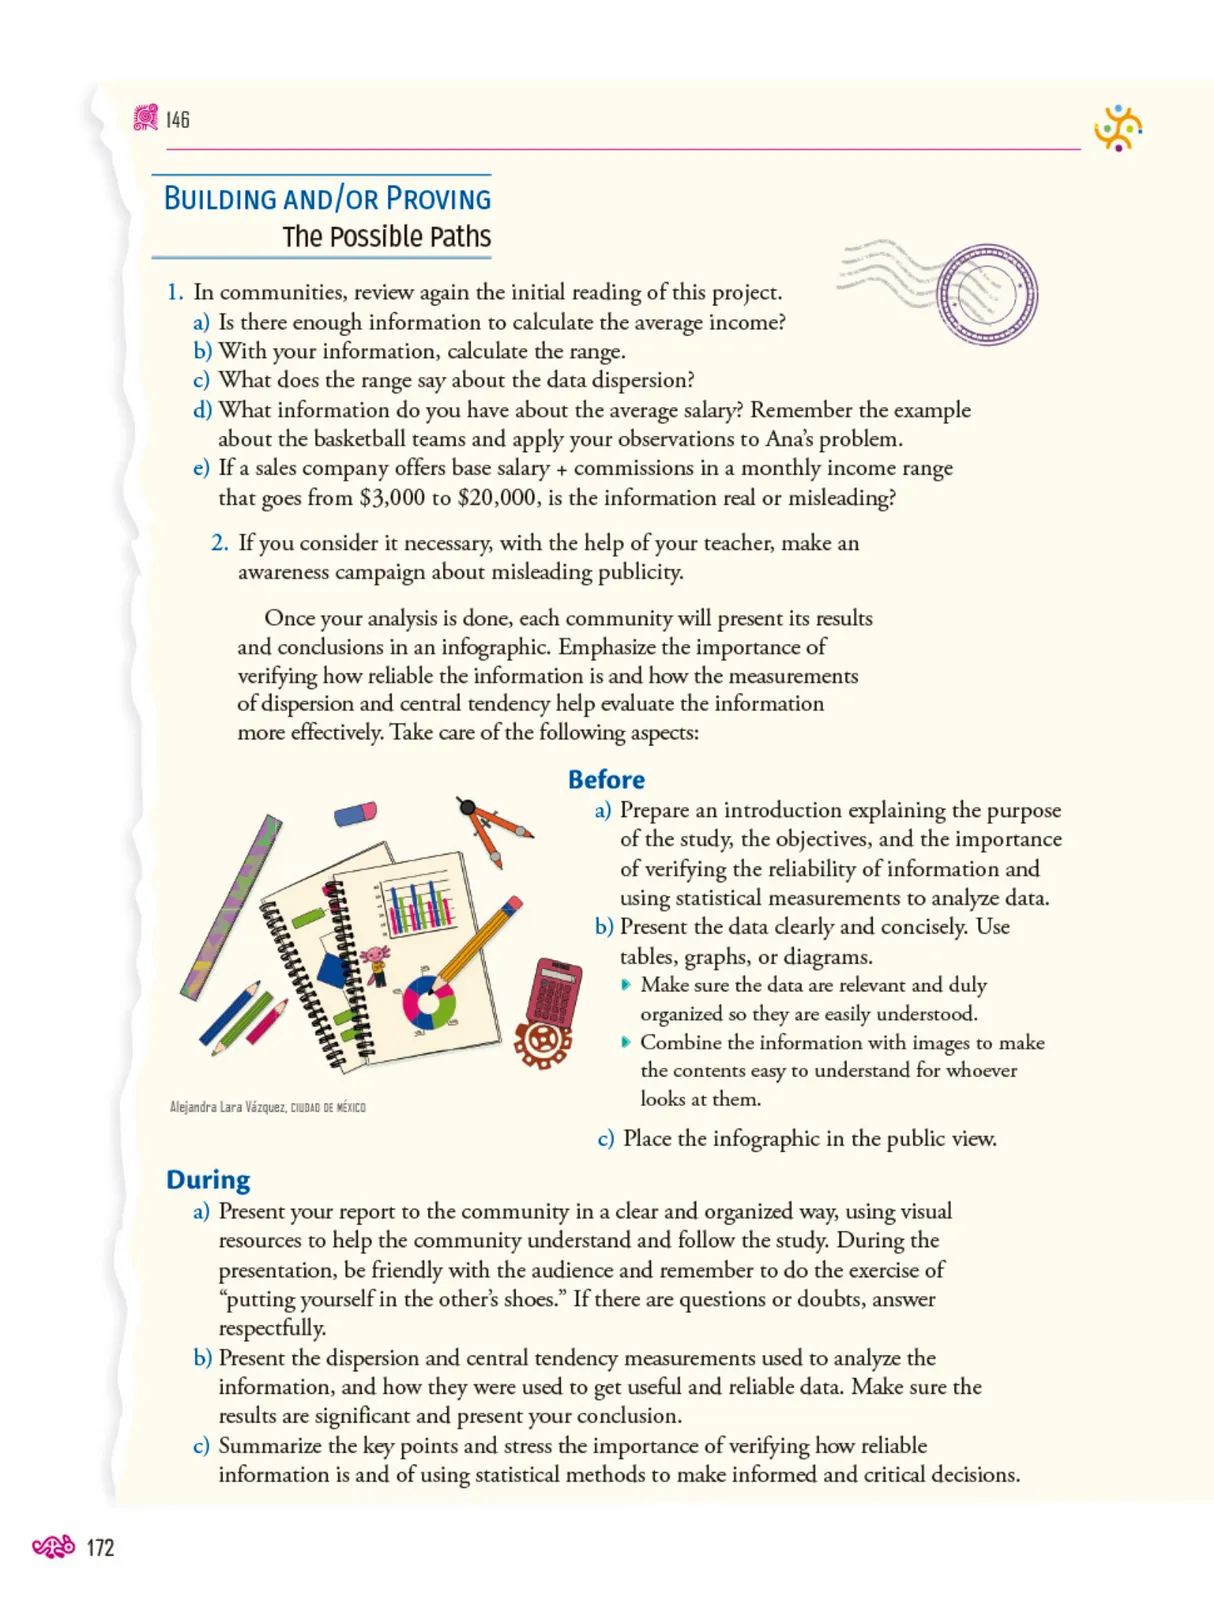
BUILDING AND/OR PROVING The Possible Paths
- In communities, review again the initial reading of this project.a) Is there enough information to calculate the average income?
b) With your information, calculate the range.
c) What does the range say about the data dispersion?
d) What information do you have about the average salary? Remember the example about the basketball teams and apply your observations to Ana's problem.
e)If a sales company offers base salary + commissions in a monthly income range that goes from 3,000 to 20,000, is the information real or misleading?
- If you consider it necessary, with the help of your teacher, make an awareness campaign about misleading publicity.
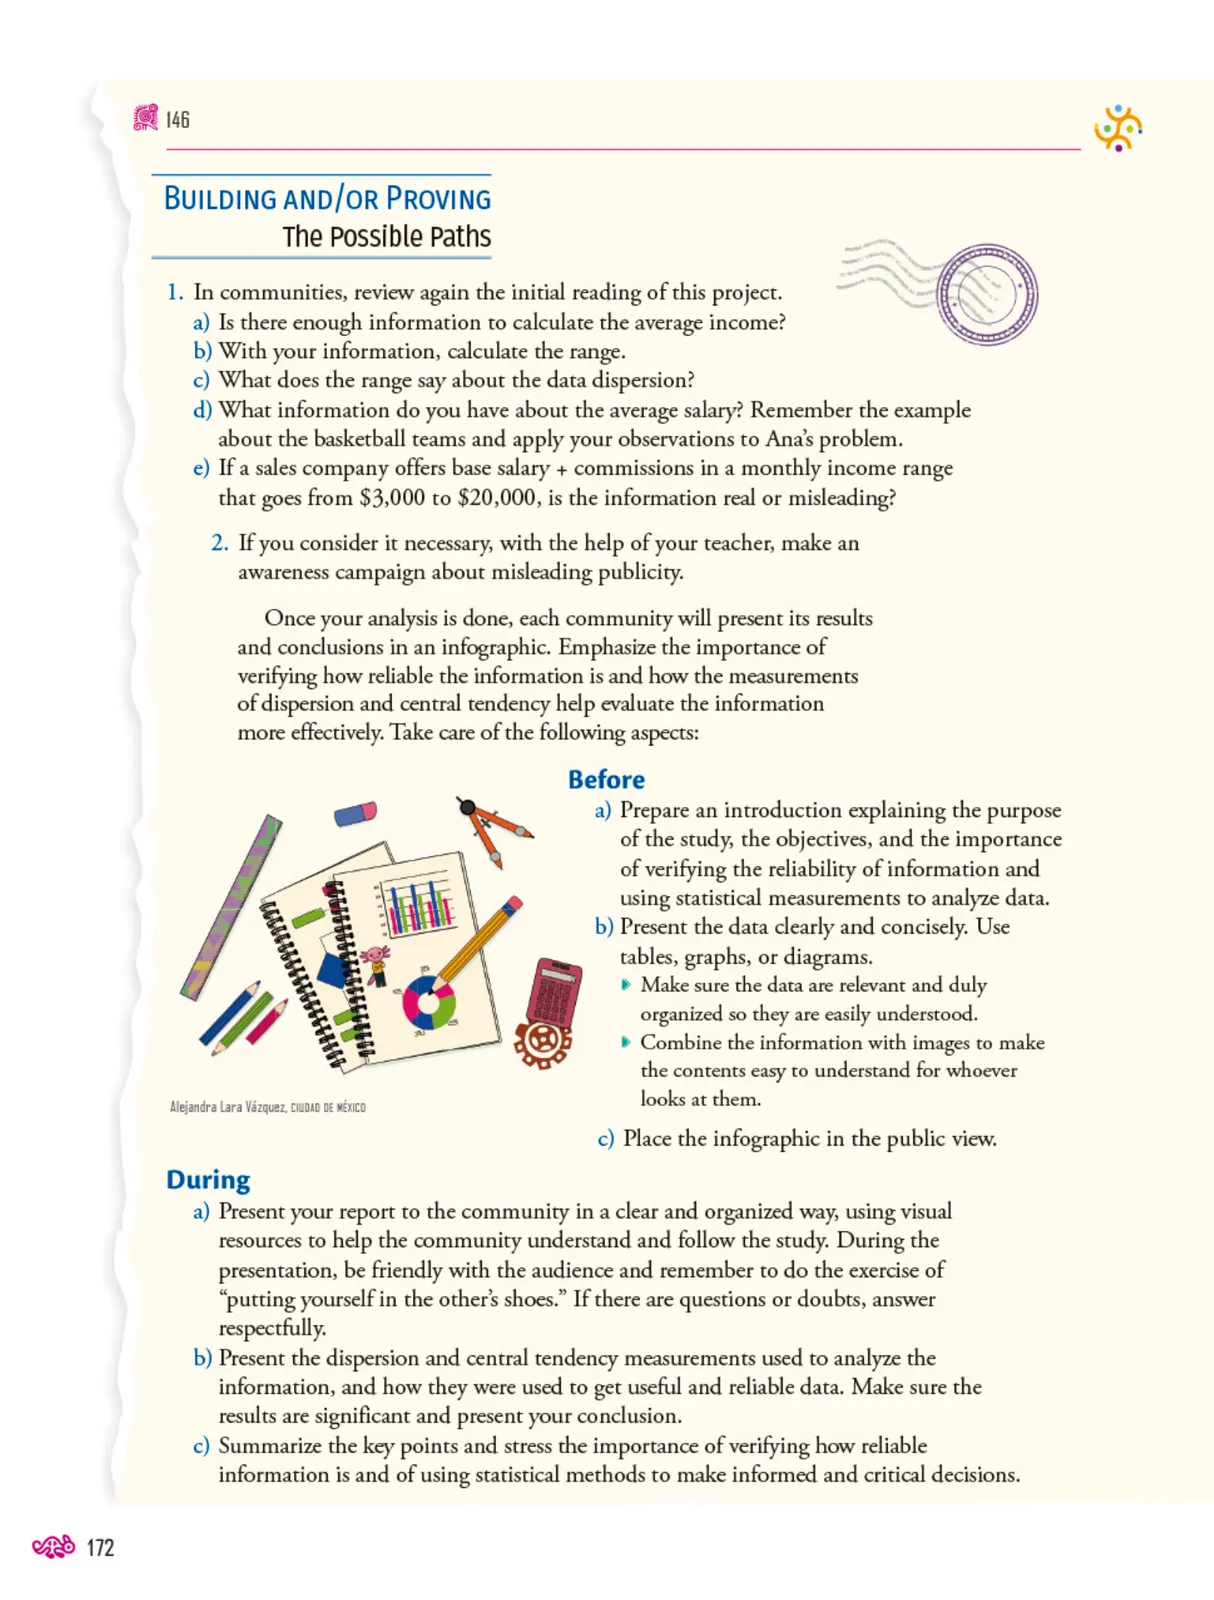
Once your analysis is done, each community will present its results and conclusions in an infographic. Emphasize the importance of verifying how reliable the information is and how the measurements of dispersion and central tendency help evaluate the information more effectively. Take care of the following aspects:
During
Before
a) Prepare an introduction explaining the purpose of the study, the objectives, and the importance of verifying the reliability of information and using statistical measurements to analyze data.
b) Present the data clearly and concisely. Use tables, graphs, or diagrams.
Make sure the data are relevant and duly organized so they are easily understood.
Combine the information with images to make the contents easy to understand for whoever looks at them.
c) Place the infographic in the public view.
a) Present your report to the community in a clear and organized way, using visual resources to help the community understand and follow the study. During the presentation, be friendly with the audience and remember to do the exercise of "putting yourself in the other's shoes." If there are questions or doubts, answer respectfully.
b) Present the dispersion and central tendency measurements used to analyze the information, and how they were used to get useful and reliable data. Make sure the results are significant and present your conclusion.
c)Summarize the key points and stress the importance of verifying how reliable information is and of using statistical methods to make informed and critical decisions.
146


Alejandra Lara Vázquez, CiuDAD DE MExico
乐
172
Otros libros recomendados

Uérakua anapu uantakua. Projects and Readings. Libro de Educación Secundaria Grado 2° Ciclo Escolar 2025 - 2026
SEP/CONALITEG
171 págs.
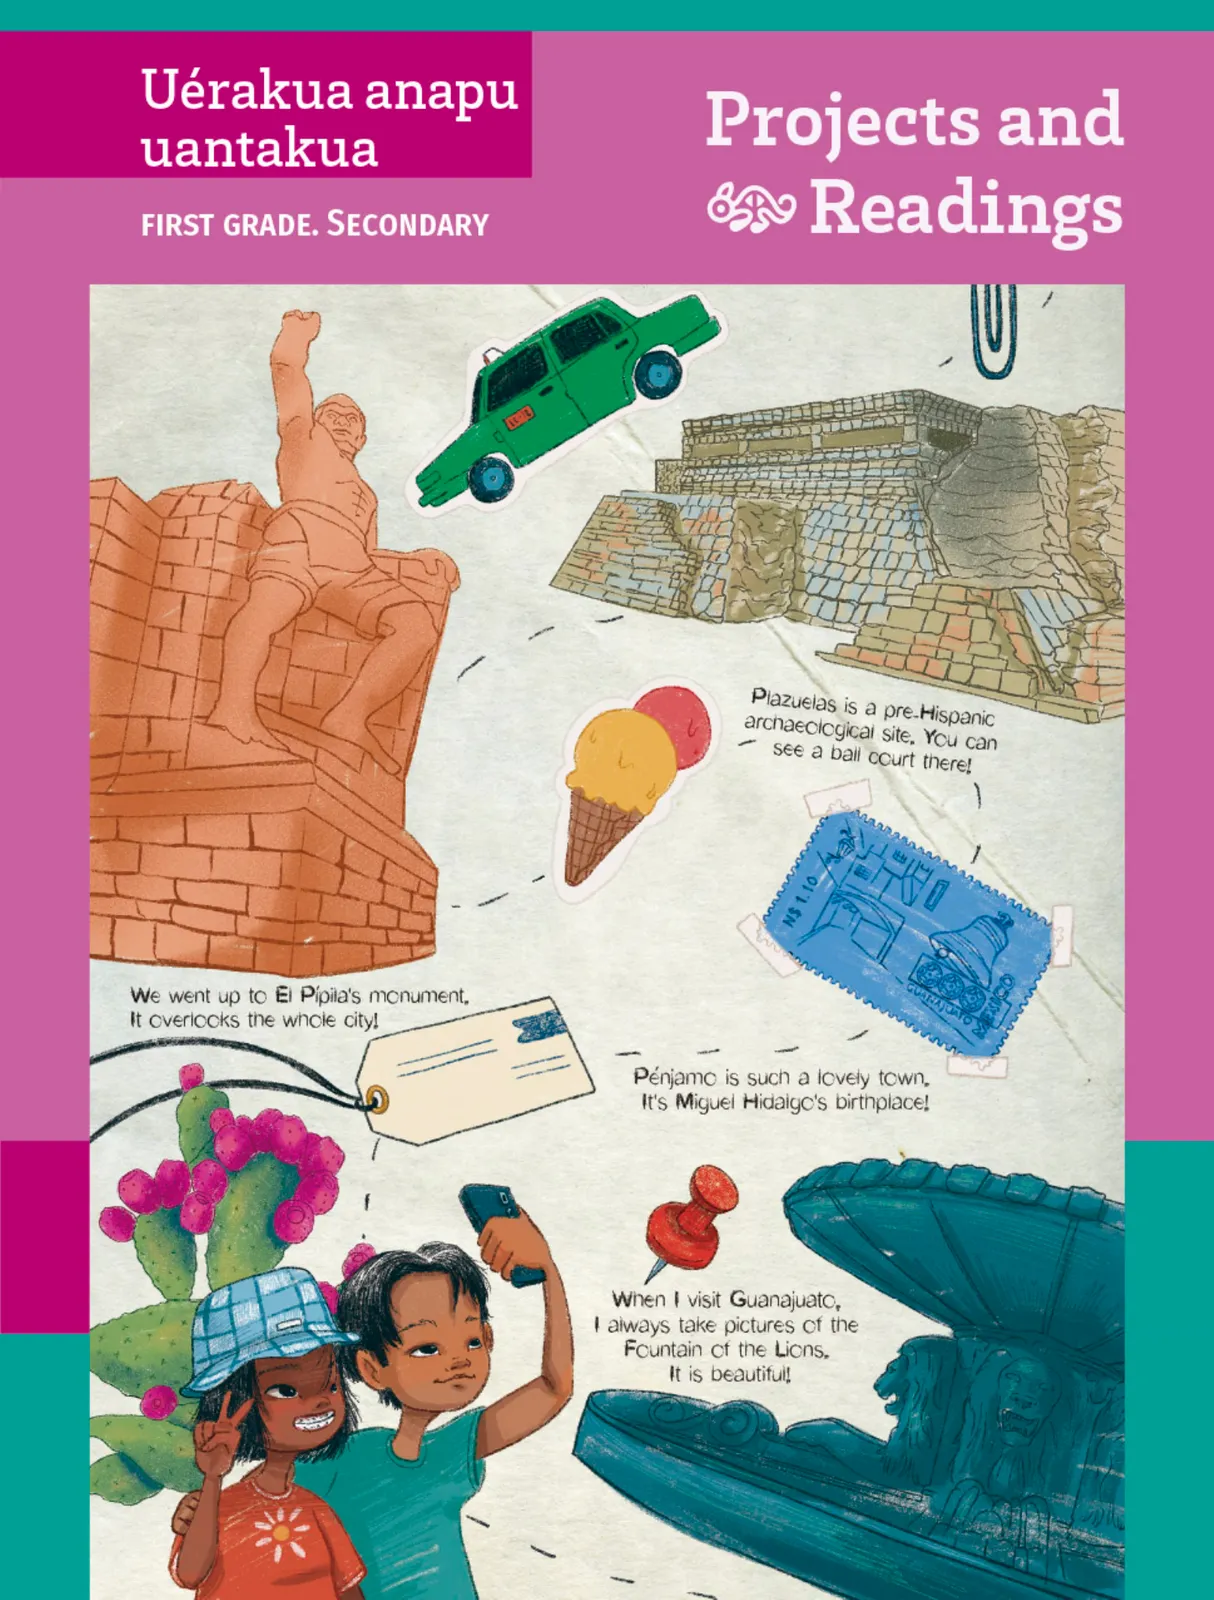
Uérakua anapu uantakua. Projects and Readings Libro de Educación Secundaria Grado 1° Ciclo Escolar 2025 - 2026
SEP/CONALITEG
187 págs.
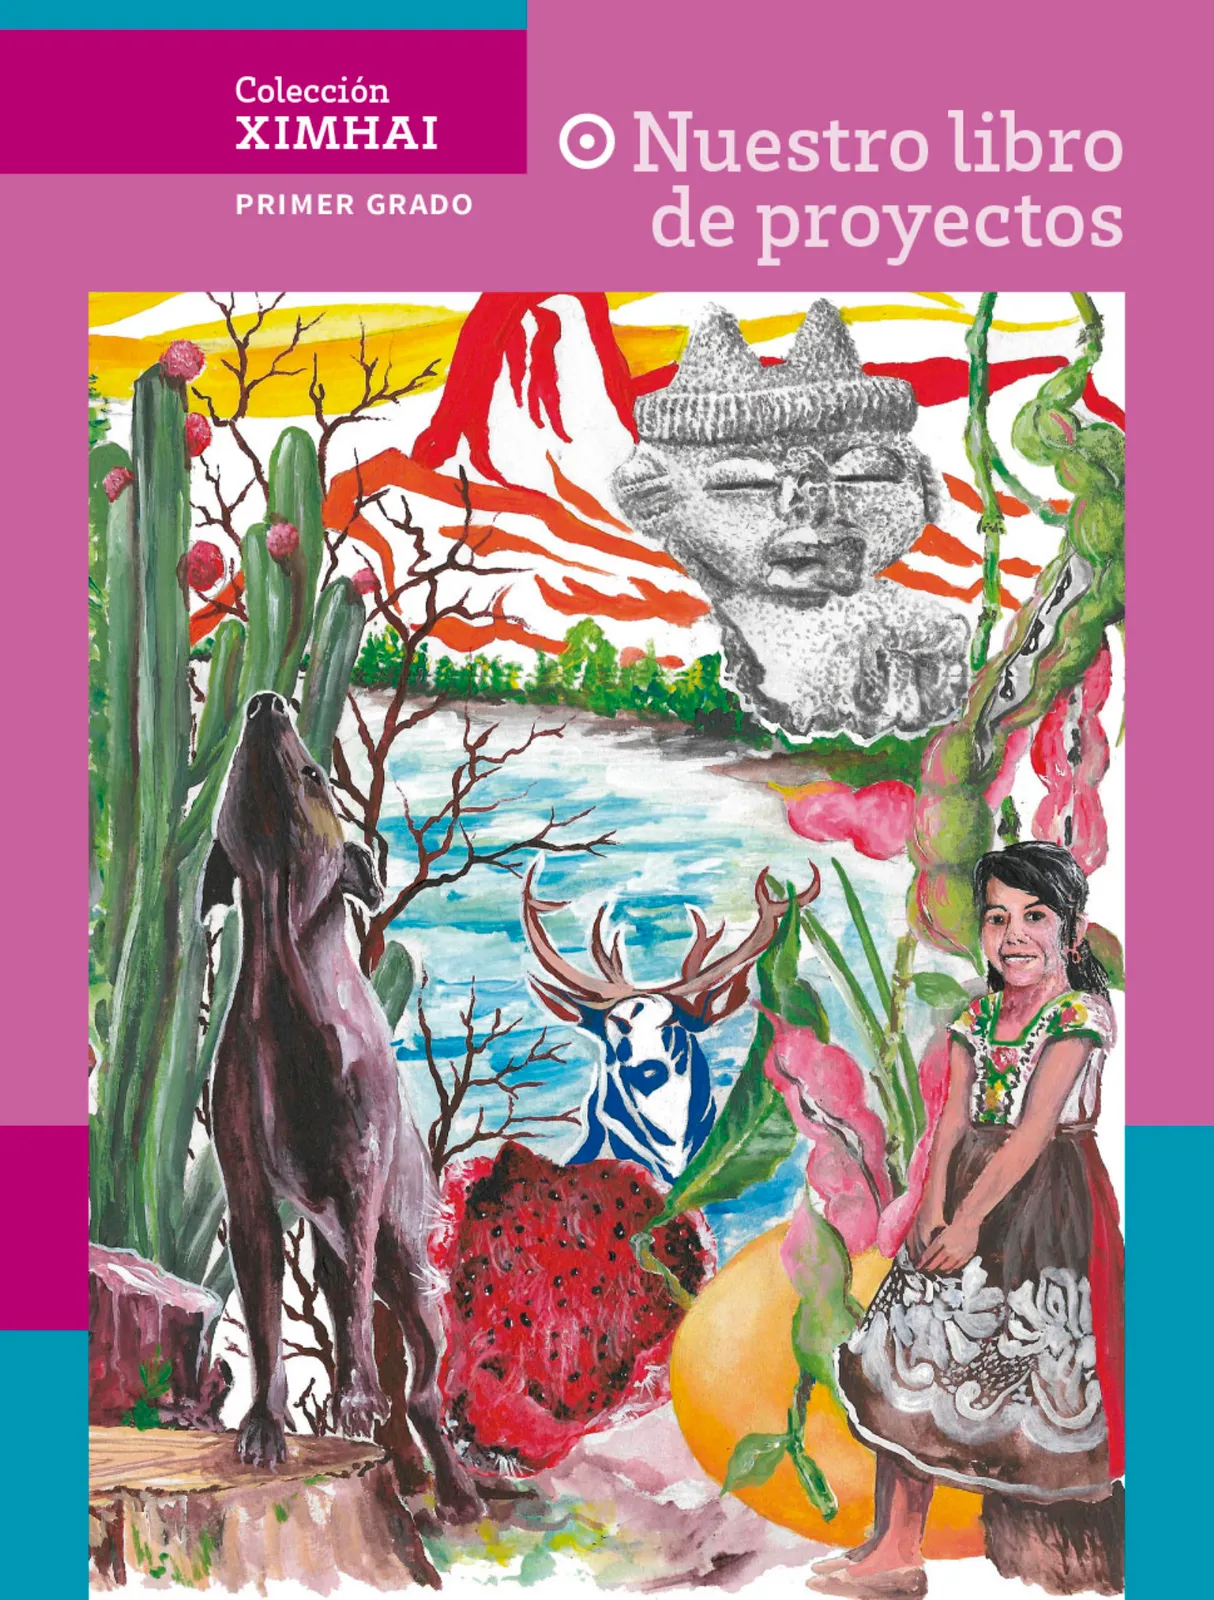
Colección Ximhai. Nuestro libro de proyectos. Libro de Educación Secundaria Grado 1° Ciclo Escolar 2025 - 2026
SEP/CONALITEG
299 págs.
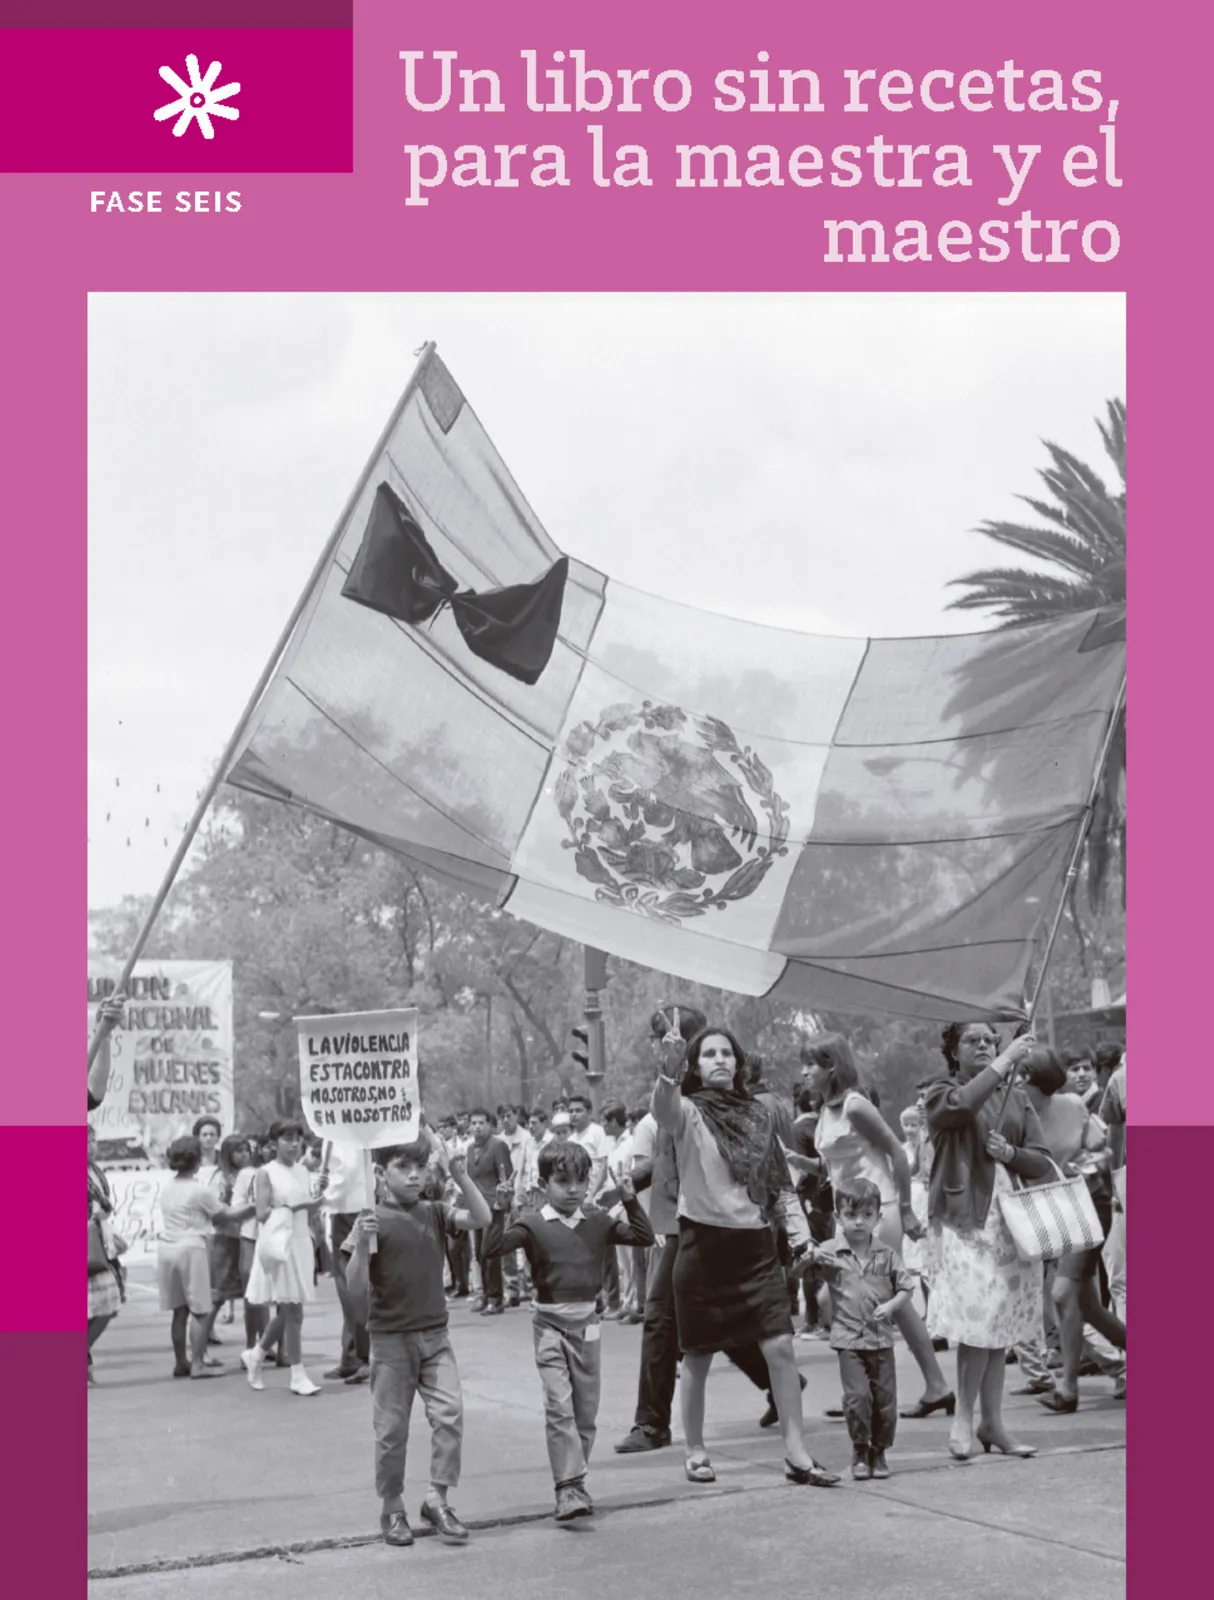
Un libro sin recetas para la maestra y el maestro. Fase 6. Libro de Educación Secundaria Grado 1°, 2°, 3° Ciclo Escolar 2025 - 2026
SEP/CONALITEG
202 págs.
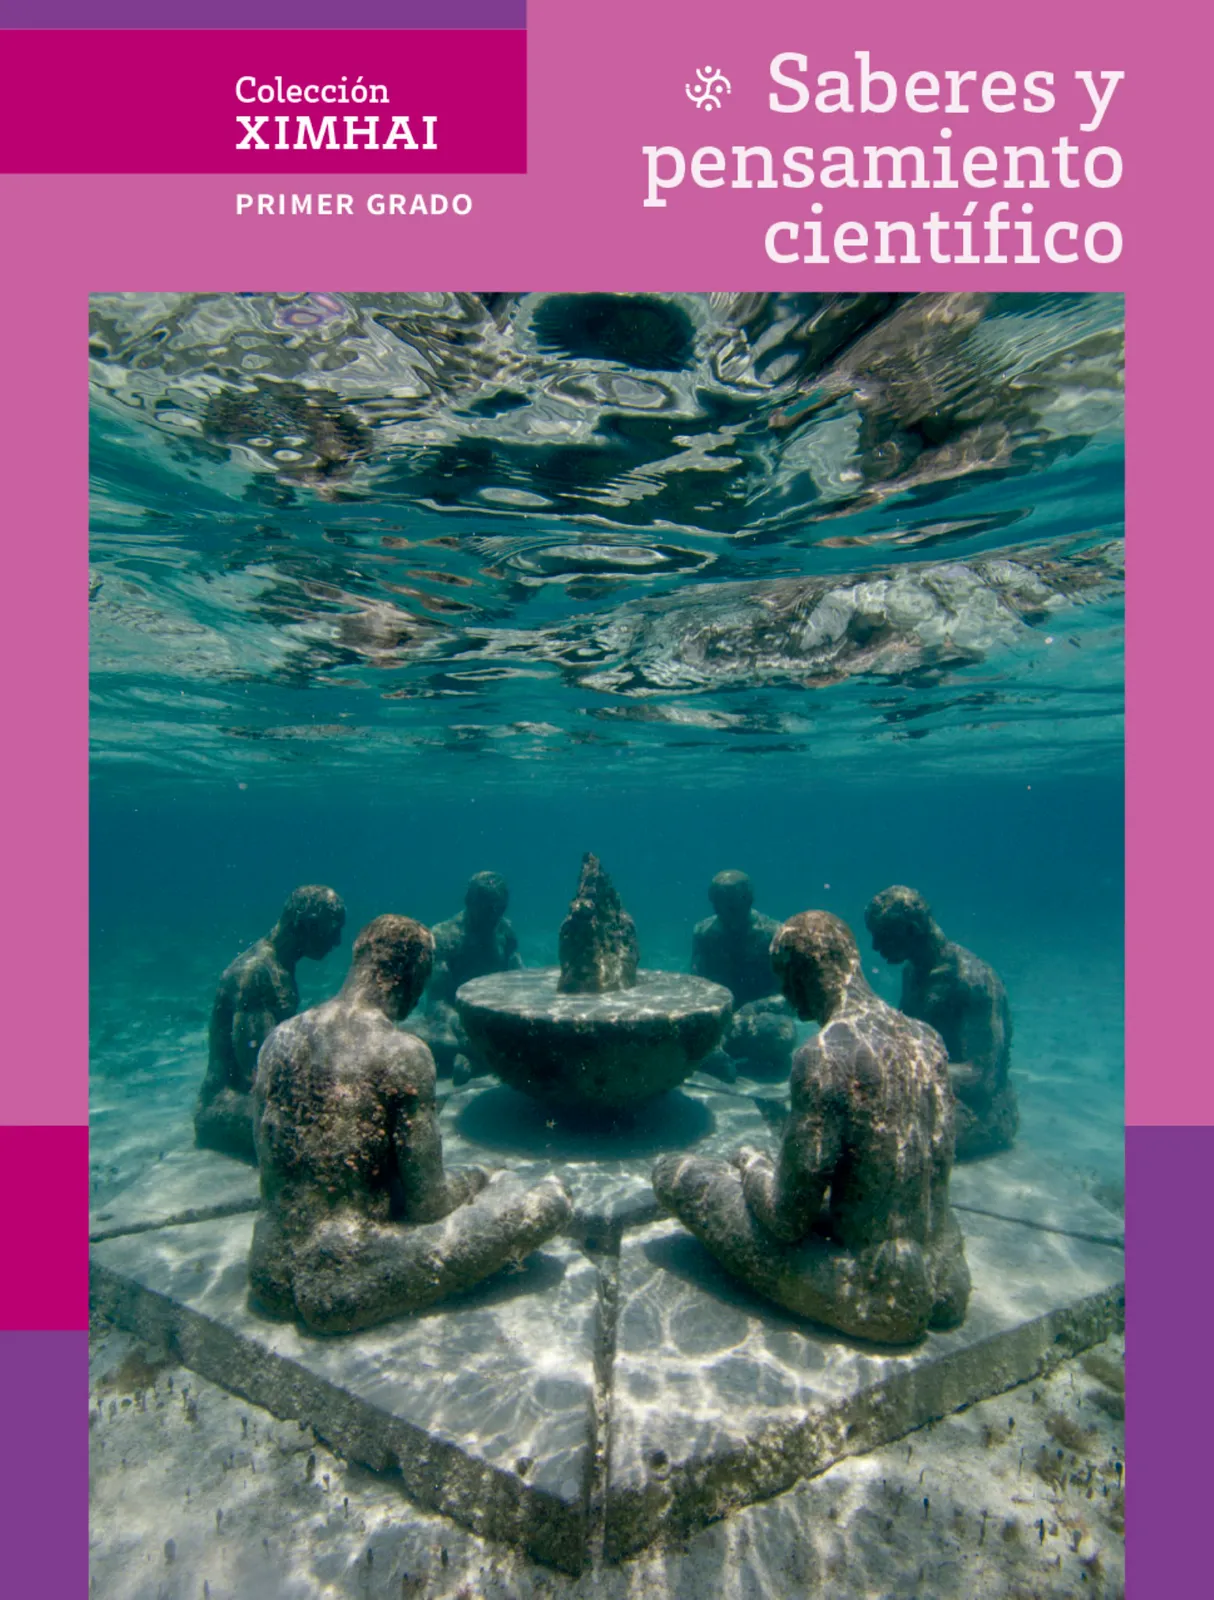
Colección Ximhai. Saberes y pensamiento científico. Libro de Educación Secundaria Grado 1° Ciclo Escolar 2025 - 2026
SEP/CONALITEG
339 págs.
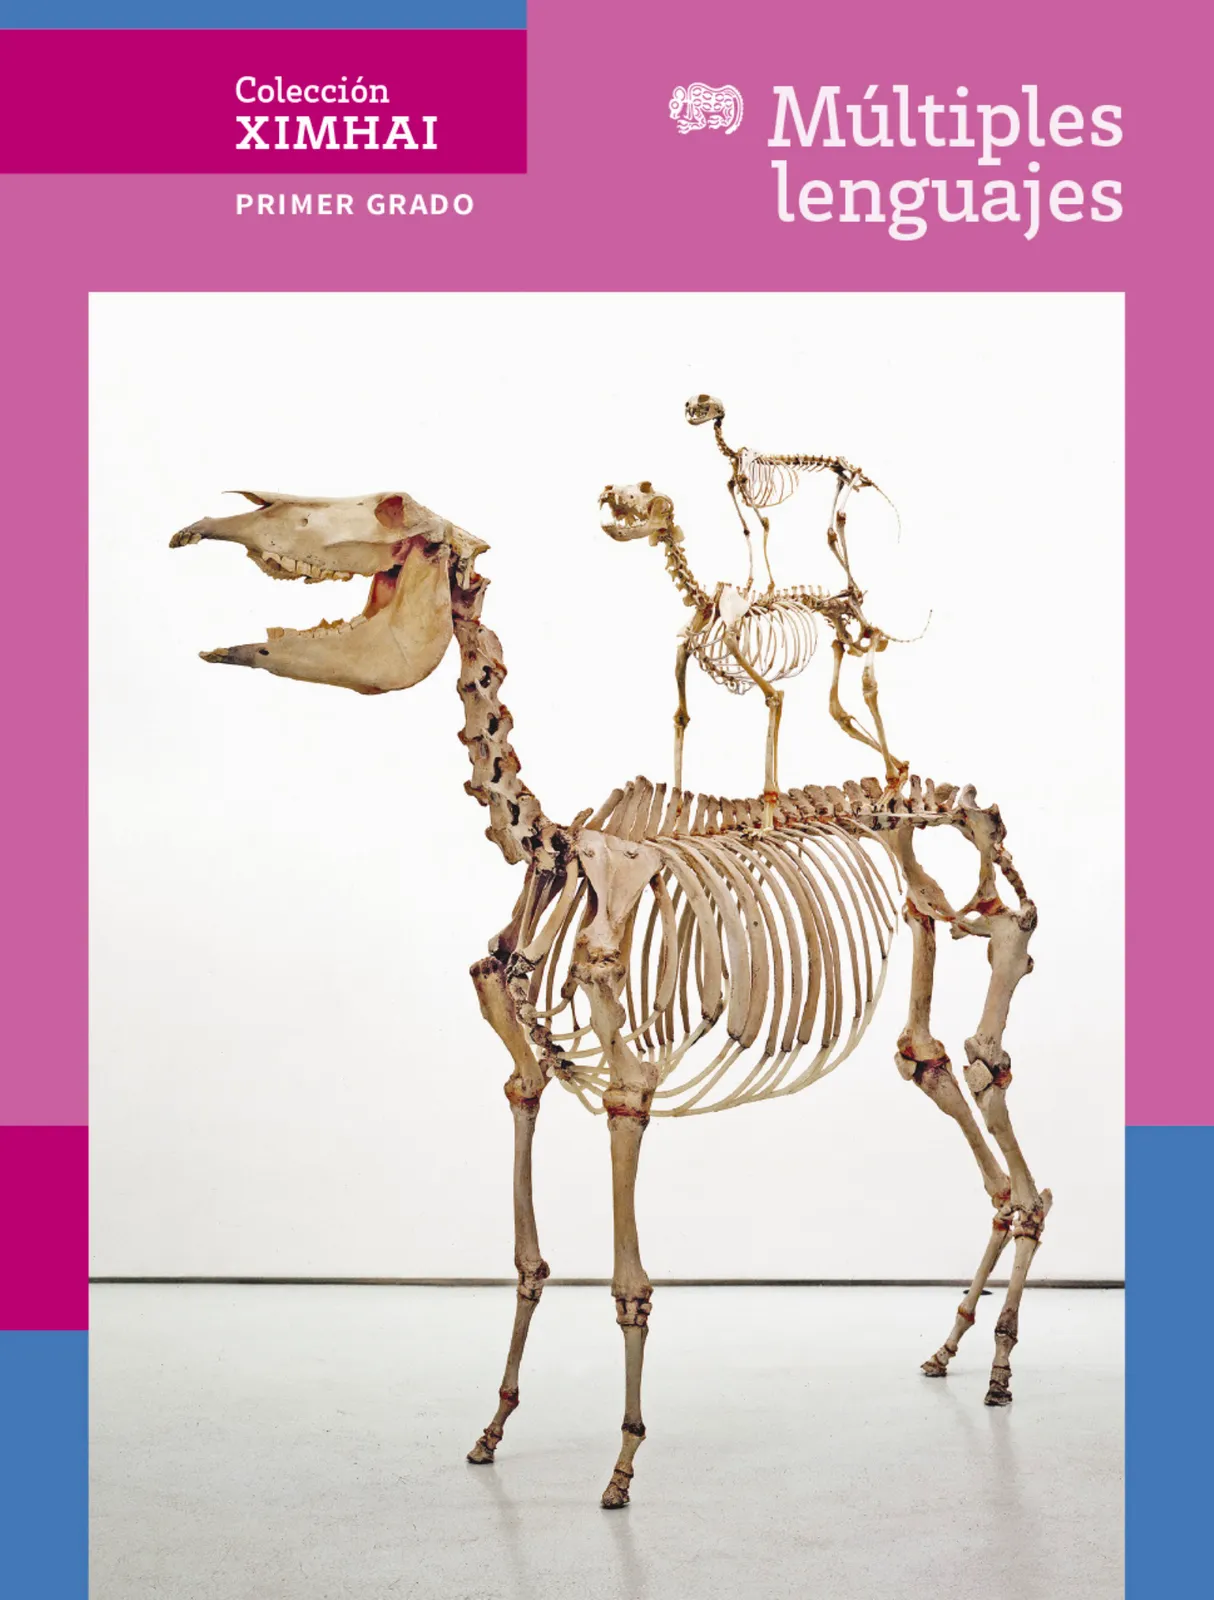
Colección Ximhai. Múltiples lenguajes. Libro de Educación Secundaria Grado 1° Ciclo Escolar 2025 - 2026
SEP/CONALITEG
163 págs.
Matematica 9° · Secundaria Activa
MinEducación
218 págs.
Ciencias Naturales 9° · Secundaria Activa
MinEducación
318 págs.