Saltar al contenido
MisLibrosTexto
Ad

Medidas de tendencia central y dispersion: encuestas sobre internet e ingresos

📄 ejercicios matematica 🎓 otro · 3° TELESECUNDARIA México 🇲🇽 MX 🗣 Español
Página 171
171 de 187
Página 171 de Uérakua anapu uantakua. Projects and Readings.  Libro de Educación Telesecundaria Grado 3°  Ciclo Escolar 2025 - 2026
Anterior Página 171 / 187 Siguiente

Respuesta rápida

6.a) 6.7 h; 6.b) alta; 6.c) 15 h; 6.d) 3.69 h; 7) el promedio no representa a cada dato individual.

📚 exercise matematica ⭐⭐ Dificultad 2/5 ⏱ 8 min lectura

Solución — Página 171

Uérakua anapu uantakua. Projects and Readings. Libro de Educación Telesecundaria Grado 3° Ciclo Escolar 2025 - 2026

5
Ejercicio 5

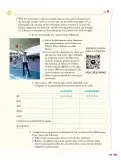
Ask your classmates if they have internet access and how many hours per week they use this service.

  1. Se pregunta a cada companero si tiene acceso a internet (si/no).
  2. A quienes responden si, se les pide el numero de horas semanales de uso.
  3. Se registran los datos en una tabla de dos columnas: estudiante y horas.

Respuesta orientativa: Se obtiene una lista de datos, por ejemplo: 0, 2, 3, 5, 5, 7, 8, 10, 12, 15 horas semanales.

6
Ejercicio 6

Once you have everyone's response, answer the following questions in your notebook.

a
Parte 6.a

What are the average hours per week that the students in your classroom use internet?

  1. Se suman todas las horas registradas: 0+2+3+5+5+7+8+10+12+15 = 67.
  2. Se divide entre el numero de estudiantes: \bar{x} = \frac{67}{10} = 6.7.
Respuesta

El promedio es 6.7 horas por semana.

b
Parte 6.b

Does the data have a lot of dispersion or little dispersion?

  1. Se calcula el rango: 15 - 0 = 15.
  2. Se observa que los datos van de 0 a 15, una diferencia grande respecto al promedio.
Respuesta

Los datos tienen dispersion alta, porque el rango es amplio y hay valores muy alejados del promedio.

c
Parte 6.c

What is the range of the data?

  1. Se identifica el valor maximo: 15.
  2. Se identifica el valor minimo: 0.
  3. Se resta: R = 15 - 0 = 15.
Respuesta

El rango es 15 horas.

d
Parte 6.d

What is the average variation of the data?

  1. Se calcula la media: \bar{x} = 6.7.
  2. Se obtienen las desviaciones absolutas: 6.7, 4.7, 3.7, 1.7, 1.7, 0.3, 1.3, 3.3, 5.3, 8.3.
  3. Se suman: 36.9.
  4. Se divide entre n: \frac{36.9}{10} = 3.69.
Respuesta

La variacion promedio es 3.69 horas.

7
Ejercicio 7

Considering your responses, explain in communities if the average represents each team's data.

  1. El promedio resume el conjunto, pero no describe a cada individuo.
  2. Dos equipos pueden tener el mismo promedio con datos muy distintos.
  3. Con solo el promedio no se puede saber la edad exacta de un jugador elegido al azar.

Respuesta orientativa: El promedio no representa necesariamente a cada dato individual; se necesita tambien la dispersion para describir el conjunto.

Seek and Find

Ad
1
Ejercicio 1

Individually, look online for a survey about sellers' income.

Respuesta orientativa:

  • 1.a Poblacion: vendedores de un mercado o region encuestados.
  • 1.b Rango de ingresos: diferencia entre el ingreso maximo y minimo reportado.
  • 1.c Ingreso promedio: suma de ingresos entre numero de encuestados.
  • 1.d Dispersion: rango, varianza o desviacion estandar de los ingresos reales.
2
Ejercicio 2

In community, write the information in your notebook and represent the results with graphs.

Respuesta orientativa: Se sugiere un histograma de frecuencias de ingresos y un diagrama de barras por categoria de vendedor.

3
Ejercicio 3

Check the webpages you consulted and answer the following questions.

Respuesta orientativa:

  • 3.a Confiable si proviene de institutos de estadistica o universidades.
  • 3.b Actualizada si la fecha es reciente.
  • 3.c Consistente si coincide con otras fuentes oficiales.
  • 3.d Relevante si responde a la pregunta sobre ingresos.
  • 3.e Clara si usa lenguaje accesible y graficos.
  • 3.f Completa si incluye metodologia y tamano de muestra.
  • 3.g Media, mediana y moda se calculan con los datos obtenidos.

Contenido de la página

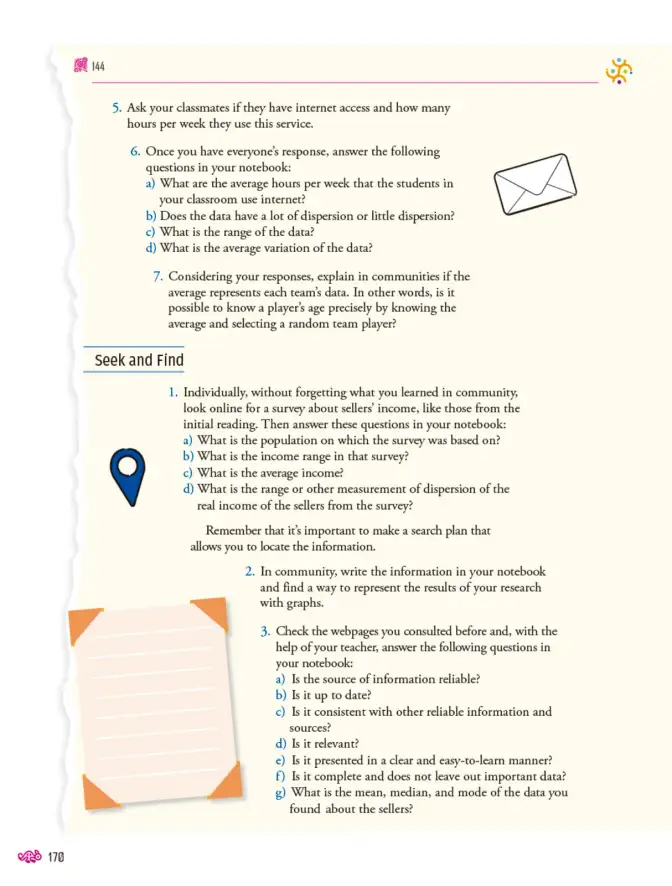
  1. Ask your classmates if they have internet access and how many hours per week they use this service.

  2. Once you have everyone's response, answer the following questions in your notebook:

a) What are the average hours per week that the students in your classroom use internet?

b) Does the data have a lot of dispersion or little dispersion?

c) What is the range of the data?

d) What is the average variation of the data?

  1. Considering your responses, explain in communities if the average represents each team's data. In other words, is it possible to know a player's age precisely by knowing the average and selecting a random team player?

Seek and Find

  1. Individually, without forgetting what you learned in community, look online for a survey about sellers' income, like those from the initial reading. Then answer these questions in your notebook:

a) What is the population on which the survey was based on?

b) What is the income range in that survey?

c) What is the average income?

d) What is the range or other measurement of dispersion of the real income of the sellers from the survey?

Remember that it's important to make a search plan that allows you to locate the information.

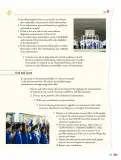
  1. In community, write the information in your notebook and find a way to represent the results of your research with graphs.

  2. Check the webpages you consulted before and, with the help of your teacher, answer the following questions in your notebook:

a) Is the source of information reliable?

b) Is it up to date?

c) Is it consistent with other reliable information and sources?

d) Is it relevant?

e) Is it presented in a clear and easy-to-learn manner?

f) Is it complete and does not leave out important data?

g) What is the mean, median, and mode of the data you found about the sellers?

Ejemplos resueltos

Datos de horas de internet: 0, 2, 3, 5, 5, 7, 8, 10, 12, 15. Calcula promedio, rango y variacion promedio.

Promedio: \bar{x} = \frac{67}{10} = 6.7. Rango: 15 - 0 = 15. Variacion promedio: \frac{36.9}{10} = 3.69.

Tabla

Estudiante Horas de internet
1 0
2 2
3 3
4 5
5 5
6 7
7 8
8 10
9 12
10 15

Fórmulas y ecuaciones

\bar{x} = \frac{\sum x_i}{n}

R = x_{max} - x_{min}

\bar{x} = \frac{\sum x_i}{n}

R = x_{max} - x_{min}

DM = \frac{\sum |x_i - \bar{x}|}{n}

Glosario (6)

Average
Promedio; suma de los datos dividida entre el numero de datos.
Dispersion
Grado de separacion de los datos respecto al promedio.
Range
Rango; diferencia entre el valor maximo y el minimo.
Mean
Media aritmetica.
Median
Mediana; valor central de los datos ordenados.
Mode
Moda; valor que mas se repite.

Preguntas para practicar

Es posible conocer la edad exacta de un jugador sabiendo solo el promedio?

No, porque el promedio es una medida resumen que no describe a cada individuo; se necesita la dispersion para saber que tan representativo es.

Como saber si una fuente de internet es confiable?

Se revisa el autor, la institucion, la fecha, la metodologia y si coincide con otras fuentes oficiales.

Temas y conceptos clave

Estadistica descriptivaEncuestas y recoleccion de datosEvaluacion de fuentes digitalesPromedioRangoDispersionVariacion promedioPoblacionMuestra

Fuentes y referencias

  • INEGI
  • Encuestas oficiales de ingresos
¿Te fue útil esta página?

Preguntas que la gente también hace

Como se calcula el promedio de un conjunto de datos?
Consulta la solución completa arriba o explora el libro entero para temas relacionados.
Que diferencia hay entre rango y desviacion media?
Consulta la solución completa arriba o explora el libro entero para temas relacionados.
Como saber si una fuente de internet es confiable?
Consulta la solución completa arriba o explora el libro entero para temas relacionados.
📌 Antes de leer esto
  • • Suma y division de numeros decimales
  • • Lectura de tablas de datos
  • • Concepto de promedio
Siguiente tema sugerido
Representacion grafica de datos estadisticos
📝 Transcripción de la página (texto seleccionable) 1941 caracteres
  1. Ask your classmates if they have internet access and how many hours per week they use this service.

  2. Once you have everyone's response, answer the following questions in your notebook:

a) What are the average hours per week that the students in your classroom use internet?

b) Does the data have a lot of dispersion or little dispersion?

c) What is the range of the data?

d) What is the average variation of the data?

  1. Considering your responses, explain in communities if the average represents each team's data. In other words, is it possible to know a player's age precisely by knowing the average and selecting a random team player?

Seek and Find

  1. Individually, without forgetting what you learned in community,look online for a survey about sellers' income, like those from the initial reading. Then answer these questions in your notebook:a) What is the population on which the survey was based on?

b) What is the income range in that survey?

c) What is the average income?

d) What is the range or other measurement of dispersion of the real income of the sellers from the survey?

Remember that it's important to make a search plan that allows you to locate the information.

  1. In community, write the information in your notebook and find a way to represent the results of your research with graphs.

  2. Check the webpages you consulted before and, with the help of your teacher, answer the following questions in your notebook:

a) Is the source of information reliable?

b) Is it up to date?

c) Is it consistent with other reliable information and sources?

d) Is it relevant?

e) Is it presented in a clear and easy-to-learn manner?

f) Is it complete and does not leave out important data?

g)What is the mean, median, and mode of the data you found about the sellers?

144

8

![](page=0,bbox=[889, 272, 1041, 388])

![](page=0,bbox=[195, 805, 264, 914])

![](page=0,bbox=[105, 1072, 444, 1476])

乐

170

Ad

Otros libros recomendados

Ver todos →
Ad

Usamos cookies propias y de terceros para personalizar contenido, mostrar publicidad y analizar el tráfico. Las cookies necesarias siempre están activas.