
















Saltar al contenido
MisLibrosTexto
Ad

Where We Are Headed: Probabilidad y tipos de sangre

📄 ejercicios matematica 🎓 bachillerato · 3° Secundaria México 🇲🇽 MX 🗣 Español
Página 101
101 de 187
Página 101 de Uérakua anapu uantakua. Projects and Readings.  Libro de Educación Secundaria Grado 3°  Ciclo Escolar 2025 - 2026
Anterior Página 101 / 187 Siguiente

Respuesta rápida

Tabla completada con datos reales; fracciones y porcentajes por tipo; oraciones de probabilidad; reflexión sobre donación y tipos más/menos comunes.

📚 exercise matematica ⭐⭐ Dificultad 2/5 ⏱ 8 min lectura

Solución — Página 101

Uérakua anapu uantakua. Projects and Readings. Libro de Educación Secundaria Grado 3° Ciclo Escolar 2025 - 2026

1
Ejercicio 1

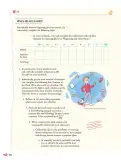
In your notebook, copy and complete the table below with the data obtained in subparagraph b) in "Beginning and Observation."

  1. Se retoman los registros obtenidos en la observación previa (subpárrafo b).
  2. Se copia la tabla de doble entrada con columnas AB+, AB-, A+, A-, B+, B-, O+, O- y Total.
  3. En la fila Records se anota el conteo de cada tipo; en Fraction of the Total se escribe \frac{\text{conteo}}{\text{total}}; en Percentage se multiplica la fracción por 100.
AB+ AB- A+ A- B+ B- O+ O- Total
Records 2 1 8 2 5 1 9 2 30
Fraction of the Total \frac{2}{30} \frac{1}{30} \frac{8}{30} \frac{2}{30} \frac{5}{30} \frac{1}{30} \frac{9}{30} \frac{2}{30} \frac{30}{30}
Percentage 6.7\% 3.3\% 26.7\% 6.7\% 16.7\% 3.3\% 30\% 6.7\% 100\%
Respuesta

Tabla completada con los datos reales del grupo (ejemplo orientativo):

2
Ejercicio 2

In community, review others' records and, with the complete information, fill the table in your notebook.

  1. Se comparan los registros individuales con los de los compañeros.
  2. Se unifican los datos en una sola tabla consensuada.
  3. Se verifica que la suma de la columna Total coincida con la suma de todos los conteos.

Respuesta orientativa: La tabla final debe integrar todos los registros del grupo; si hay diferencias, se revisa el conteo y se acuerda un dato único por tipo sanguíneo.

3
Ejercicio 3

Individually, get the total number of responses and complete the following line: Fraction of the Total. Write the results as a fraction. The numerator is the digit in each column, and the denominator is the total number of records. With the fraction, calculate the percentage.

  1. Se obtiene el total de registros: N = 30 (ejemplo).
  2. Para cada columna, la fracción es \frac{\text{conteo}}{N}.
  3. El porcentaje se calcula como \frac{\text{conteo}}{N} \times 100.
Respuesta

Por ejemplo, para O+: \frac{9}{30} = 0.30 = 30\%; para AB-: \frac{1}{30} \approx 0.033 = 3.3\%.

Ad
4
Ejercicio 4

Reflect on the observable proportions when you compare the columns.

  1. Se comparan las fracciones y porcentajes de cada tipo.
  2. Se identifica cuál columna tiene mayor proporción y cuál menor.
  3. Se relaciona con la frecuencia observada en la comunidad.

Respuesta orientativa: Las proporciones muestran que algunos tipos son más frecuentes que otros; por ejemplo, O+ suele ser el más común y AB- el menos común, lo que refleja la distribución real de los grupos sanguíneos.

5
Ejercicio 5

Show the data with more records. Look at the following example and write a sentence like the following: "B-type is more common. It has a probability of \frac{15}{100}."

  1. Se identifica el tipo con más registros (ejemplo: O+ con 9).
  2. Se escribe la probabilidad como fracción: \frac{9}{30}.
  3. Se redacta la oración comparativa.
Respuesta

"O+ type is more common. It has a probability of \frac{9}{30}."

6
Ejercicio 6

Write a sentence for each column and compare the results with your classmates.

  1. Para cada tipo sanguíneo se escribe una oración con su probabilidad.
  2. Se comparan las oraciones con las de los compañeros.
  3. Se discuten las diferencias entre los datos individuales y los grupales.

Respuesta orientativa: Cada oración debe incluir el tipo y su probabilidad, por ejemplo: "A+ has a probability of \frac{8}{30}", "AB- has a probability of \frac{1}{30}".

Ad
7
Ejercicio 7

Collectively, discuss the possibility of ensuring blood transfusions if, by any chance, most people with B-type decide to move to another place.

  1. Se analiza qué pasaría si disminuye la frecuencia del tipo B.
  2. Se reflexiona sobre la disponibilidad de donantes para transfusiones.
  3. Se concluye que la probabilidad ayuda a anticipar riesgos, pero no garantiza disponibilidad.

Respuesta orientativa: Si la mayoría de las personas con tipo B se mudara, la probabilidad de encontrar ese tipo disminuiría, lo que dificultaría las transfusiones para quienes lo necesitan; por ello es importante promover la donación y conocer la distribución local.

8
Ejercicio 8

In assembly, decide if probability can help you to identify the most and the least common blood type in your community.

  1. Se revisan los datos obtenidos y las probabilidades calculadas.
  2. Se argumenta si la probabilidad permite identificar los tipos más y menos comunes.
  3. Se llega a una conclusión grupal.

Respuesta orientativa: Sí, la probabilidad permite identificar los tipos más y menos comunes porque se basa en la frecuencia relativa de los datos; sin embargo, la precisión depende del tamaño de la muestra y de que los registros sean representativos de la comunidad.

Contenido de la página

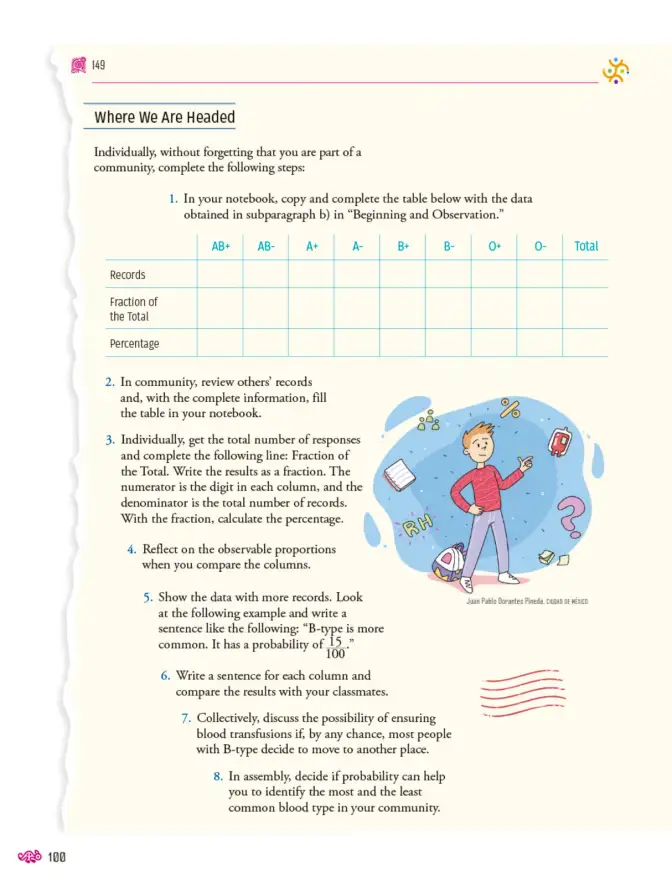
Where We Are Headed

Individually, without forgetting that you are part of a community, complete the following steps:

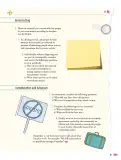
  1. In your notebook, copy and complete the table below with the data obtained in subparagraph b) in "Beginning and Observation."
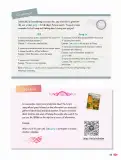
AB+ AB- A+ A- B+ B- O+ O- Total
Records
Fraction of the Total
Percentage
  1. In community, review others' records and, with the complete information, fill the table in your notebook.

  2. Individually, get the total number of responses and complete the following line: Fraction of the Total. Write the results as a fraction. The numerator is the digit in each column, and the denominator is the total number of records. With the fraction, calculate the percentage.

  3. Reflect on the observable proportions when you compare the columns.

  4. Show the data with more records. Look at the following example and write a sentence like the following: "B-type is more common. It has a probability of \frac{15}{100}."

  5. Write a sentence for each column and compare the results with your classmates.

  6. Collectively, discuss the possibility of ensuring blood transfusions if, by any chance, most people with B-type decide to move to another place.

  7. In assembly, decide if probability can help you to identify the most and the least common blood type in your community.

Ejemplos resueltos

Si el total de registros es 30 y O+ tiene 9, ¿cuál es su fracción y porcentaje?

Fracción: \frac{9}{30}. Porcentaje: \frac{9}{30} \times 100 = 30\%.

Tabla

AB+ AB- A+ A- B+ B- O+ O- Total
Records
Fraction of the Total
Percentage

Fórmulas y ecuaciones

\text{Porcentaje} = \frac{\text{conteo}}{\text{total}} \times 100

\frac{\text{conteo}}{\text{total}}

\frac{\text{conteo}}{\text{total}} \times 100

Glosario (4)

Records
Registros o conteos de cada tipo de sangre.
Fraction of the Total
Fracción que representa la parte del total.
Percentage
Porcentaje, fracción multiplicada por 100.
Probability
Probabilidad, medida de la posibilidad de que ocurra un evento.

Preguntas para practicar

¿Cómo se calcula la probabilidad de un tipo de sangre?

Se divide el número de registros de ese tipo entre el total de registros y se multiplica por 100 para obtener el porcentaje.

¿Qué tipo de sangre es más común en México?

El tipo O+ es el más común en México, seguido de A+; esto se refleja en las probabilidades calculadas.

¿Para qué sirve la probabilidad en la vida cotidiana?

Sirve para tomar decisiones informadas, como planificar donaciones de sangre o prever riesgos en salud y finanzas.

Temas y conceptos clave

ProbabilidadEstadística descriptivaTipos de sangreFrecuencia absolutaFrecuencia relativaFracción del totalPorcentajeProbabilidad empírica
¿Te fue útil esta página?

Figuras de la página (2)

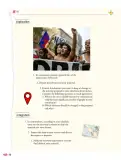
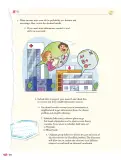
Ilustración de un estudiante señalando símbolos de porcentaje, probabilidad y tipos de sangre.
Figura 1 image
Líneas onduladas decorativas.
Figura 2 image

Preguntas que la gente también hace

¿Cómo se calcula la probabilidad de un tipo de sangre?
Consulta la solución completa arriba o explora el libro entero para temas relacionados.
¿Qué tipo de sangre es más común en México?
Consulta la solución completa arriba o explora el libro entero para temas relacionados.
¿Para qué sirve la probabilidad en la vida cotidiana?
Consulta la solución completa arriba o explora el libro entero para temas relacionados.
📌 Antes de leer esto
  • • Fracciones
  • • Porcentajes
  • • Lectura de tablas de doble entrada
Siguiente tema sugerido
Gráficas de barras y circulares para representar probabilidades
📝 Transcripción de la página (texto seleccionable) 1874 caracteres

Where We Are Headed

Individually, without forgetting that you are part of a community, complete the following steps:

  1. In community, review others'records and, with the complete information, fill the table in your notebook.

  2. Individually, get the total number of responses and complete the following line: Fraction of the Total. Write the results as a fraction. The numerator is the digit in each column, and the denominator is the total number of records.With the fraction, calculate the percentage.

  3. Reflect on the observable proportions when you compare the columns.

  4. Show the data with more records. Look at the following example and write a sentence like the following: "B-type is more common. It has a probability of 15 ."100

  5. Write a sentence for each column and compare the results with your classmates.

  6. Collectively, discuss the possibility of ensuring blood transfusions if, by any chance, most people with B-type decide to move to another place.

  7. In assembly, decide if probability can help you to identify the most and the least common blood type in your community.

149

杀

  1. In your notebook, copy and complete the table below with the data obtained in subparagraph b) in "Beginning and Observation."
AB+AB-A+A-B+B-0+0-Total
Records
Fraction of the Total
Percentage

![](page=0,bbox=[662, 708, 1090, 1068])

Juan Pablo Dorantes Pineda, CIuoaD DE MExico

![](page=0,bbox=[865, 1204, 1021, 1295])

100

Ad

Otros libros recomendados

Ver todos →
Ad

Usamos cookies propias y de terceros para personalizar contenido, mostrar publicidad y analizar el tráfico. Las cookies necesarias siempre están activas.