















Ejercicio 1
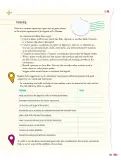
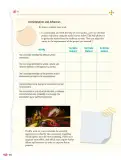
In community, and with the help of your teacher, carry out the final project evaluation using the model survey below. This will allow you to gather the results from the audience surveys. (You can adapt this survey to the requirements of the project you selected.)
- Se define la muestra: se aplica la encuesta a los visitantes del evento (público general, familias, docentes y estudiantes invitados).
- Se registra cada respuesta en la columna que corresponde: Yes (Most Visitors) si la mayoría respondió afirmativamente, Yes (Some Visitors) si solo una parte, No (A Few Visitors) si casi nadie lo percibió.
- Se tabulan los resultados por reactivo y se calcula el porcentaje de respuestas afirmativas de cada fila.
- Se interpretan los datos: los reactivos con mayor porcentaje de "Yes (Most Visitors)" son las fortalezas del proyecto; los de mayor porcentaje en "No" son las áreas de mejora.
| Activity | Yes (Most Visitors) | Yes (Some Visitors) | No (A Few Visitors) |
|---|---|---|---|
| The community identified the different artistic expressions. | ✔ | ||
| The community identified the artistic, cultural, and symbolic elements in the legend of La Llorona. | ✔ | ||
| The community identified current problems in their environment portrayed in the representations. | ✔ | ||
| The presentation arose feelings or ideas about a current social problem. | ✔ | ||
| The presentation or play attracted the public or audience and transmitted some knowledge or a message. The presentation was a significant experience. | ✔ |
Respuesta
encuesta aplicada y tabulada; ejemplo de tabla de resultados (los valores son un modelo de cómo llenarla, no datos reales):